User Onboarding · 8 min read
What Is the Product Adoption Curve and How Is It Important?
The product adoption curve is a bell curve of when five groups take up a new product: innovators (2.5%), early adopters (13.5%), early majority (34%), late majority (34%) and laggards (16%). Everett Rogers drew it in 1962 by slicing adoption times at standard deviations from the average; Geoffrey Moore added the chasm in 1991.
 By Hilal Yıldırım

In short
The product adoption curve splits a market into five adopter groups by how early they take up something new. Its shares are slices of a normal distribution, not survey results, so your own users won't split exactly that way. The chasm between early adopters and the early majority is where most products stall, and SaaS teams can use the curve to change their message, segment campaigns and onboard each group as it arrives.
The five shares printed on every product adoption curve, 2.5%, 13.5%, 34%, 34% and 16%, aren't survey results. Everett Rogers got them by drawing adoption times as a normal distribution and cutting it at one and two standard deviations from the average, which is why your own customers will never split exactly that way. The history usually gets told backwards too: Rogers published the curve in 1962, and Geoffrey Moore added the chasm in 1991, not the other way round.
Think of any new technology, from the metaverse to the latest AI assistant. Some people buy in on day one, some criticise it, and most wait to see what others do. Promoters and detractors are always around a new product, and the product adoption curve explains the order in which they show up.
What is the product adoption curve?
The product adoption curve (also called the technology adoption curve) is a model of how different groups of people take up a new product over time, from the first enthusiasts to the last holdouts. It helps product teams set realistic goals for adoption and helps management prepare for who comes next.
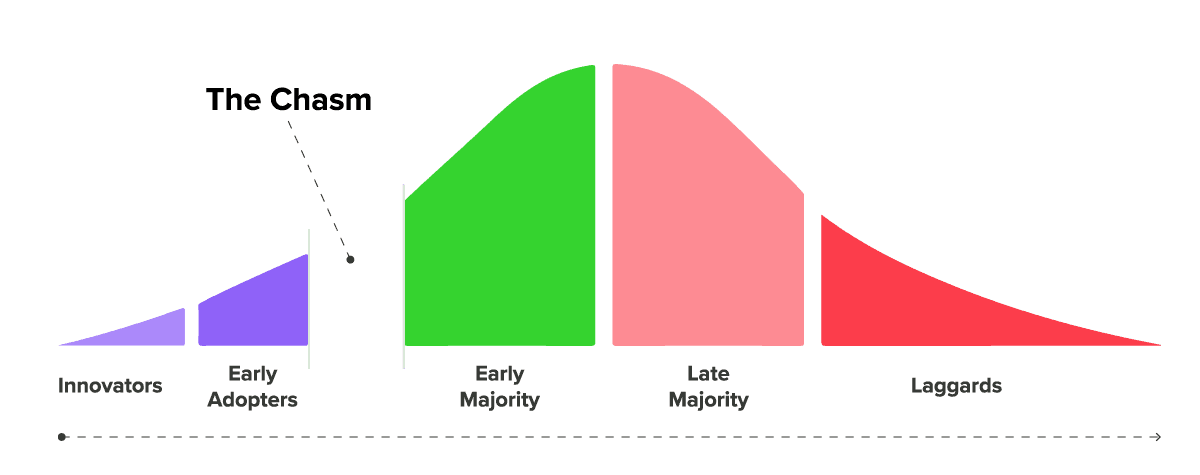
The curve divides a market into five adopter categories:
- Innovators
- Early adopters
- Early majority
- Late majority
- Laggards
The same data can be drawn two ways. The bell curve shows how many people adopt in each period: few at first, a peak, then a long tail. The S-curve shows the cumulative total: a slow start, a steep middle when the majorities arrive, and a flat top when the market is saturated. If someone shows you an S-shaped adoption curve, it's the same model added up.
Who invented the product adoption curve?
Everett M. Rogers, an American sociologist, introduced the adopter categories in his 1962 book Diffusion of Innovations, which reached its fifth edition in 2003. He drew on rural sociology studies, including Bryce Ryan and Neal Gross's 1943 study of how Iowa farmers took up hybrid seed corn, so the model was about farming long before it was about software.
Geoffrey A. Moore, an American management consultant, applied the model to technology markets in his 1991 book Crossing the Chasm. He kept Rogers's five groups and added the chasm: a gap between early adopters and the early majority where many technology products stall. (An earlier version of this post had the order reversed, with Moore first and Rogers forty years later.)
Rogers had no intention of influencing the SaaS market in 1962, but the model was so useful that marketers in almost every industry adopted it.
Where do the 2.5%, 13.5% and 34% shares come from?
The shares come from the shape of a normal distribution, not from counting real adopters. Rogers drew the time each person takes to adopt as a bell curve and cut it at the average and at one and two standard deviations from it, as set out in Diffusion of Innovations:
| Category | Share | Where it sits on the curve | Moore's name for the group |
|---|---|---|---|
| Innovators | 2.5% | More than two standard deviations earlier than average | Technology enthusiasts |
| Early adopters | 13.5% | Between two and one standard deviation earlier | Visionaries |
| Early majority | 34% | Between one standard deviation earlier and the average | Pragmatists |
| Late majority | 34% | Between the average and one standard deviation later | Conservatives |
| Laggards | 16% | More than one standard deviation later | Sceptics |
Two things follow. First, treat the shares as rough proportions, not targets: a niche B2B tool may never see laggards, and a consumer app can skip straight to the majorities. Second, the boundaries are about timing, so the same person can be an innovator for one product and a laggard for another.
What are the 5 adopter categories?
Each adopter category wants something different from your product, so each needs a different message and a different kind of proof.
1- Innovators (2.5%)
Innovators are the risk-takers who value being first over what the product does. They're tech enthusiasts, usually tech-savvy, and in a sense they're like kids with a new toy:
- They stop using your tool as soon as it isn't interesting any more.
- They don't mind minor technical issues; they want to experience the whole product.
- They like taking risks, and that's often the main reason they tried your product.
- They don't care much whether your product succeeds or fails.
✅ Innovators make a great base of beta testers and give in-depth feedback on a new product.
❌ They're interested in novelty more than value, so their customer lifetime is short and they add little to conversion.
2- Early adopters (13.5%)
Early adopters find your product early, often before it's fully developed, and they're the first people who want to benefit from it: your first true active users. They resemble innovators, with one major difference: early adopters are selective about what they recommend. If they don't see a future for your product, they won't spread the word.
✅ Early adopters give feedback, write reviews, recommend you and can spend a lot if they believe in your potential.
❌ They're hard to convince, and if you can't win them, you won't reach the mass market.
Critical: the chasm
Moore observed that many technology products fail at the same point: right after the early adopters.
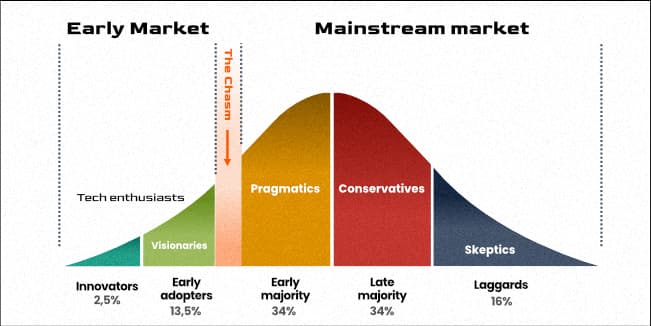
In Crossing the Chasm, Moore describes that point as the move from the "early market" to the "mainstream market", where most of the revenue is. Visionaries buy a product for what it could become; pragmatists buy what already works and is proven by people like them. If you can't bridge that gap, you haven't planned the diffusion of your product correctly. The way across is to know what the mainstream market needs.
3- Early majority (34%)
The early majority are pragmatists who research before they buy and need to be convinced you're the best solution to their problem. They're your first firm customer base and they'll pay for a solution that works.
As Moore explains, pragmatists rely on the recommendations of other pragmatists, not on early adopters. That's an obstacle, because early adopters give you the most word of mouth and the early majority mostly doesn't listen to them.
✅ They need your product and will pay for it, and once you've reached them you've crossed the chasm.
❌ They're harder to convince: they want data and references from peers.
4- Late majority (34%)
The late majority are sceptical and adopt mostly when the new way has become the norm around them. They need proof of worth more than proof of value or popularity: that your product is easy to use, worth their time and worth changing their habits for. Many already have a solution that works well enough for them, even if they know it's outdated.
Think of Facebook. Many parents who once kept their children off it ended up on it themselves, once everyone they knew was there.
✅ The late majority isn't impossible to convince; they need more time and proof.
❌ If you ignore them and stop at the early majority, your customer base won't grow enough to compete.
5- Laggards (16%)
Laggards come on board only when they have no other option. If the world switched to cryptocurrency tomorrow, laggards would keep using cash among themselves for as long as they could.
Laggards matter for two reasons:
- They're not a small group, so failing to convince them leaves a large share of the market untouched.
- If they're attached to their old methods and you get on their nerves, they can become vocal detractors.
✅ When laggards start arriving, your category has become mainstream, and it's time to make changes before the product goes stale.
❌ Laggards rarely pay for something new by choice, so don't build your growth plan around them.
How can the product adoption curve be used for SaaS?
Use the curve to decide who you're selling to right now, then change your message, your campaigns and your onboarding to match. Four steps:
Use a different message for each stage
What each group needs:
- Innovators: something new to play with.
- Early adopters: a glimpse of a promising future.
- Early majority: proof that you solve their problem, from people like them.
- Late majority: proof, reviews, time and a smooth start.
- Laggards: no other choice.
Statistics won't excite the early market, and promises won't convince the mainstream market. Change the tone of your copy and your visuals as you move from one to the other.
Segment your marketing campaigns
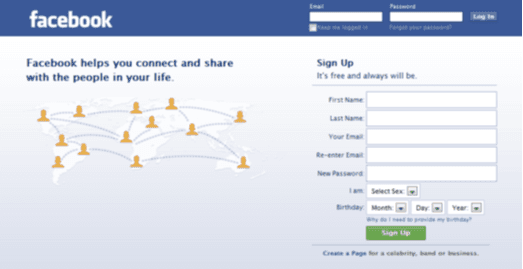
A product that sticks to one message for its whole lifecycle won't last. Facebook's sign-up page shows the shift. Early on, it promised connection with people everywhere, a message for enthusiasts:
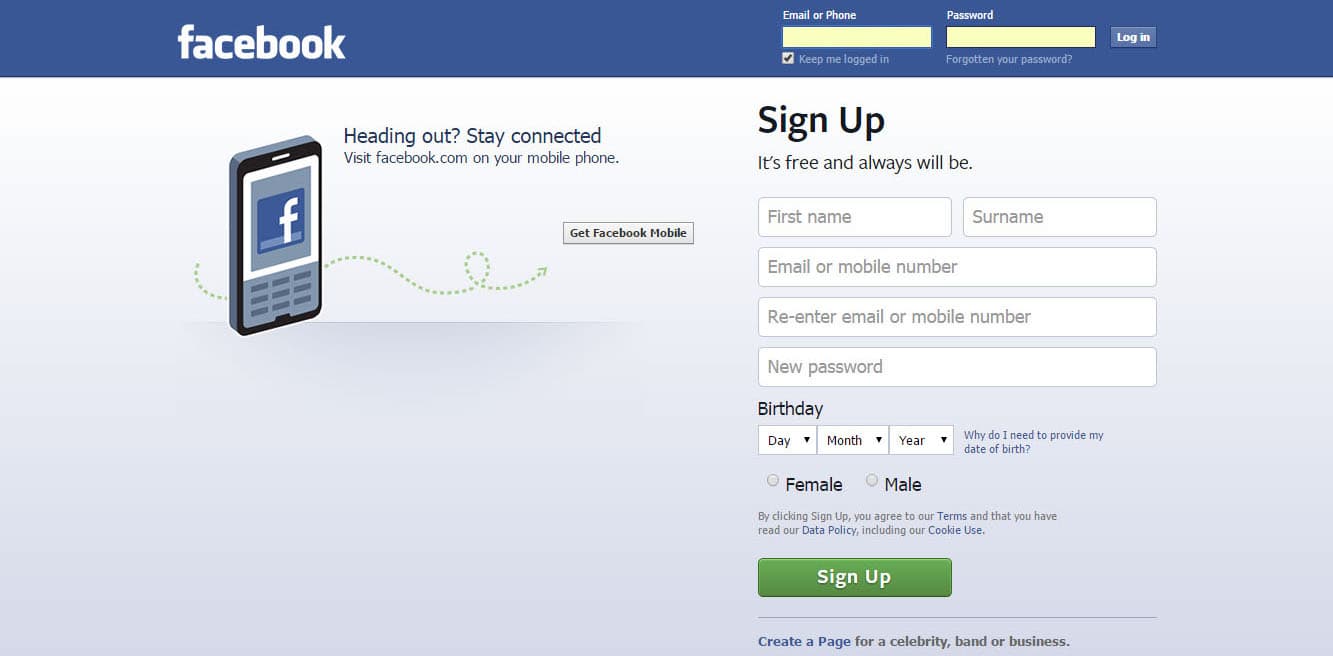
A later version pushed a practical use, staying connected on your mobile phone, the kind of message pragmatists respond to:
By the version below, the page needed no pitch at all: a log-in box, a button to create an account and the same line about connecting with people. When nearly everyone already knows the product, including the late majority and laggards, the page can assume it.
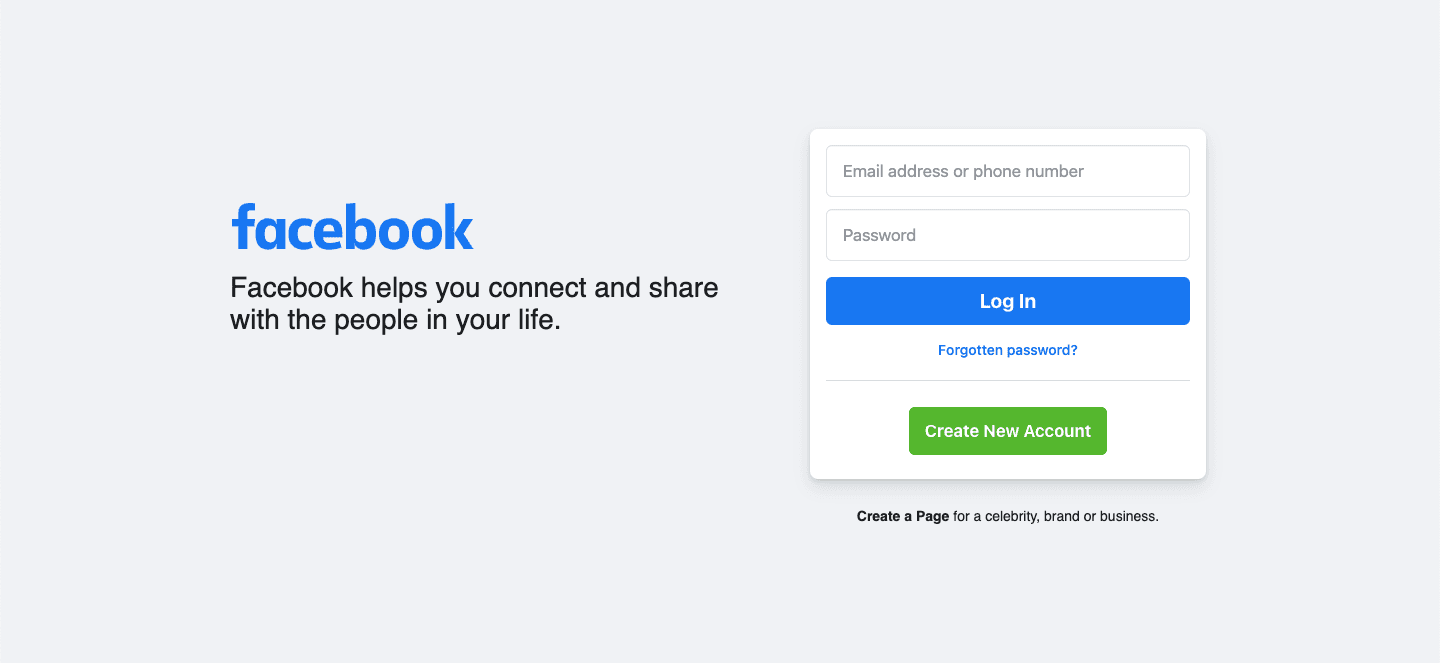
In October 2021, Facebook's parent company renamed itself Meta, which the original author read as the sign that even the laggards had arrived and it was time to change.
Get every group onboard smoothly
Facebook wasn't the first social network, nor the last. In the original author's view, what kept its customer lifecycle long was onboarding: it was easy to use for its time, and its first-run flow pushed new users to add friends and start sharing right away. Each adopter group arrives with less patience than the one before, so your onboarding flow has to get simpler as you move along the curve, not more complex.
The curve also repeats inside your product. Every new feature gets its own small adoption curve, with a few users who try it on day one and a long tail who only switch when the old way goes away. Watch product adoption metrics per feature, and use new feature onboarding to bring the majority along.
Be patient, but keep adapting
Facebook launched in 2004 and kept growing for years, changing its interface and features along the way while keeping the core idea. When its parent became Meta, it was adapting to what the next adopters would want. Your product won't follow the same path, but the lesson holds: cross the chasm with proof, then keep changing as each new group arrives.

About the author
Hilal YıldırımHilal is a creative content writer highly focused on growth, occasionally product, and always onboarding.