Tooltip · Built with Userflow
Amplitude’s contextual tooltip is actually helpful
Amplitude's contextual tooltip suggests turning a bar chart into a data table while the user builds it, with a one-click convert button and a No thanks.
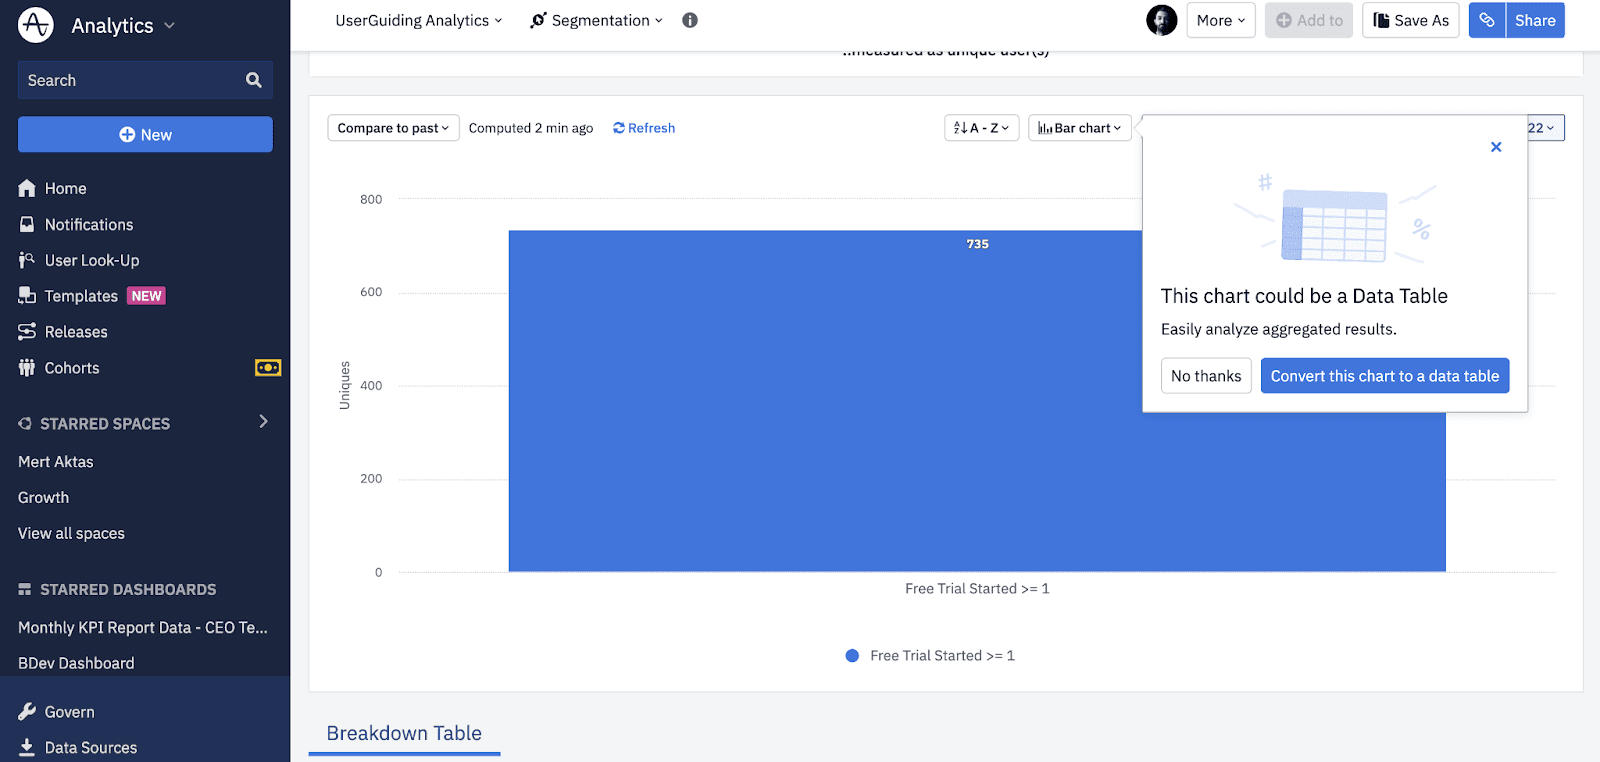
At the time of the screenshot, Amplitude showed a contextual tooltip while the user was working on a bar chart in its Segmentation view. Anchored to the chart controls, the tooltip says "This chart could be a Data Table" and adds one line on why: it's easier to analyse aggregated results. Two buttons give a clear choice (No thanks, or Convert this chart to a data table), and a close icon sits in the corner.
Why it works
✅ Non-disruptive: the tooltip is small and sits beside the chart, so it doesn't interrupt the user's workflow.
✅ Helpful, not pushy: it doesn't force a new feature on anyone or ask them to read much. It appears because there's a better way to do the task at hand, and the main button does the conversion in one click.
✅ Easy to dismiss: a No thanks button and a close icon give the user two ways out.
More on this pattern: contextual onboarding and tooltips. This example is listed as built with Userflow; see the Userflow review.